
Feature Importance.
When making predictions we are often bombarded with the question, “Which features are most usefull in the model? or rather significant” We are going to take into consideration three methods:
- permutation importance
- partial dependence plots and
- SHAP() values
permutation importance
As the name permutation suggests, this method shuffles the values in a certain column i.e feature and a prediction is made while holding other features as they are. By shuffling the data in such a manner we expect the prediction accuracy to drop as the values are different all together, this procedure is repeated and an average is calculated from the same. The method is applied to all other features and their importance is rated. We have an output which shows the confidence i.e + or - some value of how the feature affects the prediction accuracy.
PDP (Partial Dependence Plots)
Partial dependence plots demonstrate how a property influences the prediction. Partial dependency charts, like permutation importance, are computed after a model has been fitted. The model is fitted to real-world data that has not been modified in any manner.
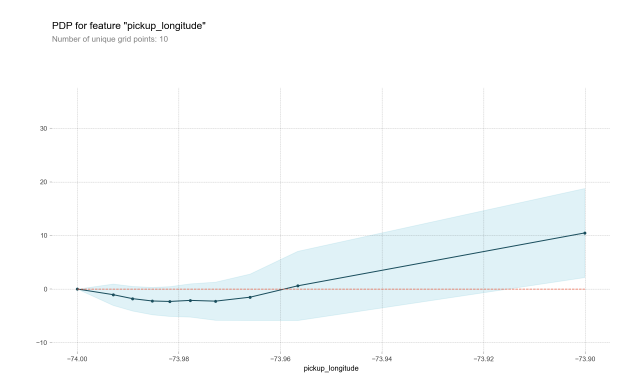
Looking at the coding example above we see the pdp plot for pick-up longitude having a U-shaped kind of a plot which would suggest that being picked up near the center of the longitude values lowers predicted fares on average, because it means shorter trips on average.
We can also create a 2D plot for the features pickup_longitude and dropoff_longitude which yields

We expect the contours to run along the diagonals. We see that prices increase as we move further up to the upper right side of the plot.
It would also be interesting to see what kind of a pdp, scaled distance would produce. Plotting the absolute distances we have the plot:
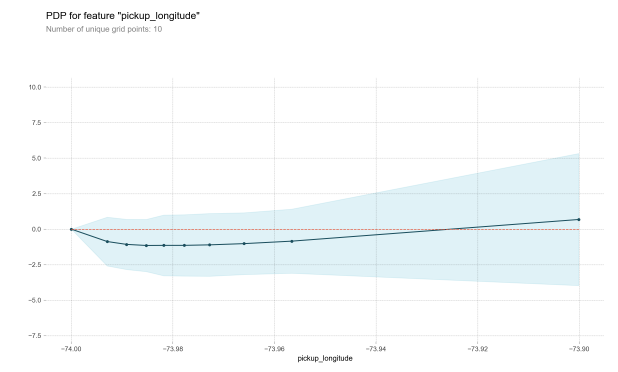
We see that controlling for absolute distance traveled, the pick up longitude has a very small impact on predictions looking at the yielded plot.
SHAP
SHAP Values (an acronym from SHapley Additive exPlanations) break down a prediction to show the impact of each feature. Which is usually the average marginal contribution of a feature value over all potential coalitions rather.
Looking at the output below:
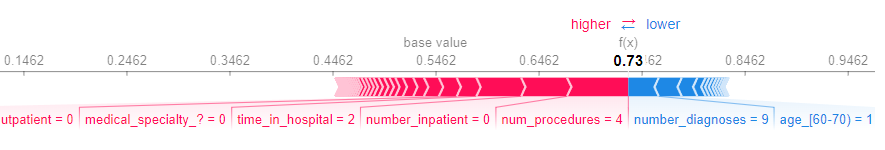
it would be safe to conclude that “num_procedures” and “number_inpatient” are quite important features.